Results
We had previously reported that SD rapidly upregulates
Htr2a expression in the mouse cortex [
27]. However, since this study was performed in cortical homogenates, it was unclear in what cortical regions this upregulation was taking place. This is important since levels of both
Htr2a mRNA and 5-HT2AR protein display a distinctive anterior-posterior gradient in the rodent cortex [
40,
41,
42]. This raised the question of whether SD was increasing
Htr2a expression in regions where the receptor is already expressed or inducing it
de novo in regions where it is normally not expressed. We therefore examined the cortical region in which SD induces
Htr2a expression.
We first tested whether we could replicate published in situ hybridization findings showing that SD upregulates
Egr3 [
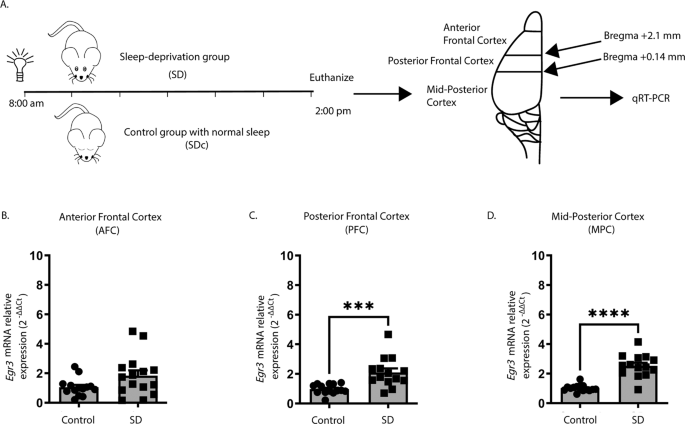
26] using quantitative reverse transcription (qRT) PCR. Fig.
1A shows the SD protocol and coordinates for regional brain dissection. In WT mice, we found that 6 h of SD did not increase
Egr3 expression in the most anterior region of frontal cortex (AFC) but did significantly upregulate
Egr3 mRNA in the posterior part of the frontal cortex (PFC), as well as in more posterior regions of cortex (labeled “mid-posterior cortex” (MPC)) (Fig.
1B–D).
Fig. 1: Sleep deprivation upregulates Egr3 in a region-dependent manner in the frontal cortex.
 (A)
(A) SD protocol. In WT mice quantitative RT-PCR shows that 6 h of SD (
B) does not increase
Egr3 expression in AFC regions (t27 = 1.956;
p = 0.0609; SDc,
n = 14; SD,
n = 15), but significantly upregulates
Egr3 mRNA in (
C) PFC (t26 = 3.979,
p = 0.0005; SDc,
n = 14; SD,
n = 14) and (
D) MPC (t27 = 7.307;
p < 0.0001; SDc,
n = 15; SD,
n = 14) regions, compared to SDc. Unpaired student’s
t test, ***
p < 0.001, ****
p < 0.0001. Values represent means ± SEM. (Abbreviations: AFC anterior frontal cortex; PFC posterior frontal cortex; MPC mid to posterior cortex; SD sleep deprivation; SDc SD control; WT wildtype; h hours).
Full size image
We next examined whether 6 h of SD can upregulate
Htr2a expression in the same cortical regions, and whether this requires
Egr3 (Fig.
2A–C). In the AFC, SD increased
Htr2a expression when both genotypes were analyzed together (two-way ANOVA), but not in either WT or
Egr3−/− groups independently (post-hoc analyses were not significant) (Fig.
2A). However, in the PFC of WT mice, SD significantly increased
Htr2a mRNA compared to SDc, a result that was absent in
Egr3−/− mice (Fig.
2B). In the MPC, SD also increased
Htr2a mRNA in WT mice, though the relative amount of the increase was less than in the PFC. Again, this effect did not occur in
Egr3−/− mice (Fig.
2C).
Fig. 2: Sleep deprivation upregulates Htr2a in an Egr3-dependent, and region-specific, manner.
 (A
(A–
C) In WT and
Egr3−/− mice qRT-PCR shows that 6 h of SD (
A) increases
Htr2a overall in the AFC when both genotypes were analyzed (two-way ANOVA, sig. main effect of SD (F1,50 = 8.279,
p = 0.0059; WT: SDc,
n = 15; SD,
n = 14;
Egr3−/−: SDc,
n = 12; SD,
n = 13)) but not in either genotype alone (post-hoc analyses showed no sig. differences between genotypes or SD conditions). (
B) However, SD significantly upregulates
Htr2a expression in the PFC of WT, but not
Egr3−/−, mice, compared to SDc (two-way ANOVA, sig. main effect of SD (F 1,53 = 12.08,
p = 0.0010; WT: SDc,
n = 15; SD,
n = 15;
Egr3−/−: SDc,
n = 12; SD,
n = 15); post-hoc analyses showed a sig. increase of
Htr2a mRNA after SD (vs. SDc) in WT mice (
p = 0.0088), but not in the
Egr3−/− mice (
p = 0.6777)). (
C) In the MPC, SD increased
Htr2a in WT, but not
Egr3−/−, mice, compared to SDc (two-way ANOVA, sig. main effect of SD (F 1,47 = 13.14,
p = 0.0007; WT: SDc,
n = 15; SD,
n = 14;
Egr3−/−: SDc,
n = 10; SD,
n = 12)); post-hoc analyses showed sig. increase of
Htr2a mRNA after SD (vs. SDc) in WT mice (
p = 0.0205) but not in the
Egr3−/− mice (
p = 0.2343). (
D) Representative images from
n = 3 per group of RNAscope in situ hybridization demonstrating
Htr2a expression in SDc and SD WT and
Egr3−/− mice. Bonferroni-corrected comparisons: *
p < 0.05, **
p < 0.01. Values represent means ± SEM.
Full size image
To further characterize the regional distribution of
Htr2a expression in response to SD, and in the absence of
Egr3, we conducted RNAscope in situ hybridization. Fig.
2D shows that 6 h of SD increases
Htr2a expression in WT mice in a region-specific manner. Compared to WT mice,
Egr3−/− mice have lower levels of
Htr2a mRNA throughout most of the cortex, sparing selected brain regions. SD may produce small increases in some regions of
Egr3−/− mice, though this is less consistent than in WT mice.
In WT mice that did not undergo SD (SDc), RNAscope in situ hybridization showed a distribution pattern of
Htr2a mRNA similar to prior studies in rats using radioactive in situ hybridization [
40,
41]. This includes high levels of expression in the anterior frontal cortex, particularly in a thin layer (L) of cells at the L1/L2 border and in the deep L2/3–L5 (L4 not present in anterior frontal cortex), with relatively lower signal in L6a. Also consistent with prior studies,
Htr2a mRNA levels decrease with progression toward more posterior cortical regions, with notable reductions in L2/3, less drastic reductions in expression in L5, overall minimal L6a expression, and strong expression in L6b bordering the corpus callosum. In the posterior frontal cortex (Bregma +2.1–+0.14) expression of
Htr2a is present in L2/3 in the somatomotor areas (MOs, MOp) and medial somatosensory cortex (SSp), but notably absent from the lateral SSp, and supplementary somatosensory cortex (SSs), with posterior progression. This absence of
Htr2a in L2/3 in the SSp/s is evident in prior studies in rat as well [
40,
41].
In areas outside of the cortex,
Htr2a expression in WT SDc animals is seen in the piriform cortex (PIR), olfactory tubercle (OT), taenia tecta dorsal and ventral (TTd/TTv), anterior olfactory nucleus (AON), and substantia innomata (SI) with strong expression in the claustrum (CL) and endopiriform cortex (dorsal) (EPd). Low level
Htr2a expression is also seen in patches in the caudate/putamen (CP) as well as in the lateral and medial septum (LS, MS). Low level expression is also seen in the hypothalamus.
Following sleep deprivation in WT mice, the overall level of
Htr2a in the anterior frontal cortex (anterior to Bregma +2.1) does not appear to be increased compared to SDc, however the laminar distribution that is apparent in SDc animals becomes less clearly delineated, suggesting a potential increase in expression in some regions and decrease in expression in others. In contrast to the cortex, in this anterior part of the brain SD produces a marked increase in expression in the olfactory regions, including the AON, OT, as well as the PIR (particularly the pyramidal layer, PIR2), EPd, and TTd & TTv, compared to WT SDc mice.
In the PFC (Bregma +2.1–+0.14) SD increases overall
Htr2a expression in WT mice, while also resulting in a more diffuse pattern, with loss of clear laminar signal, compared to SDc. Cortical areas in which SD produces the greatest increases in
Htr2a levels include the anterior cingulate (ACAv, ACAd), & somatomotor areas (MOs, MOp), as well as more lateral regions, including the agranular insular area (AI). Notably,
Htr2a expression in L6b is unchanged or only slightly increased by SD in WT mice. SD induces diffuse
Htr2a expression in the CP, and potentially small increases in the MS and hypothalamus (this was not consistent across different animals in the same group).
Compared with WT mice, in
Egr3−/− mice that did not undergo SD (SDc)
Htr2a expression is reduced throughout the cortex, an effect that becomes more pronounced with progression in the posterior direction. The exceptions to this
Egr3-depencence of
Htr2a expression are the cells in L6b, as well as in the CL and EP and PIR, in which expression is only mildly reduced in
Egr3−/− mice. Despite the reduced expression, a clear laminar distribution remains in the SDc mice, with most of the residual cortical expression in L5 & L4, and almost no expression evident in L2/3.
Despite the reduced expression of
Htr2a in
Egr3−/− mice, SD does appear to increase
Htr2a mRNA in some brain regions of these animals. This induction is not consistently seen in the anterior frontal cortex but is clear in more posterior cortical regions (most evident in the ACA and MO, the same regions where SD increases expression in WT mice). L6b expression is only mildly increased, if at all, by SD in
Egr3−/− mice. In regions outside of the cortex, SD increases
Htr2a expression in the EPd, PIR, TT, AON, and OT, in
Egr3−/− mice, though not to the levels seen in WT mice. Expression in the CL is not obviously affected by SD in
Egr3−/− mice.
To determine if SD also increases 5-HT2AR protein levels, we performed receptor autoradiography with the selective 5-HT2AR antagonist 3H-M100907 on brain sections from WT and
Egr3−/− mice at baseline and following 8 h SD (to allow time for translation of mRNA) (Fig.
3A). We found that, in the AFC, SD results in an overall increase in 5-HT2AR binding that differs between genotypes, but this increase is not significant in either WT or
Egr3−/− genotypes alone (Fig.
3B). However, SD increases WT expression sufficiently to produce a significant difference in 5-HT2AR levels between WT and
Egr3−/− mice that is not present in SDc animals (Fig.
3B, comparison between WT and
Egr3−/− in the SD groups). In the PFC, 8 h of SD significantly increases 5-HT2AR levels in WT mice but not in
Egr3−/− mice (Fig.
3C). In addition, 5-HT2AR levels are significantly greater in WT than
Egr3−/− mice in this region both at baseline (replicating our prior radioligand binding assay findings [
25]), and following SD. In the MPC, where endogenous
Htr2a expression is lower than in more anterior cortical regions, SD does not increase 5-HT2AR levels in WT or
Egr3−/− mice (Fig.
3D), and levels of 5-HT2AR are lower in
Egr3−/− mice than WT mice at baseline and following SD. Fig.
3E–G show representative autoradiographic images from WT and
Egr3−/− mice under SDc and SD conditions.
Fig. 3: SD increases 5-HT2AR levels in the PFC of WT mice in an Egr3-dependent manner.
 (A)
(A) 8 h SD protocol. Quantification of 3H-M100907 binding autoradiography shows that SD, compared with SDc: (
B) in AFC results in significantly greater 5-HT2AR levels in WT mice than
Egr3−/− mice after SD (two-way ANOVA, sig. main effects of SD (F 1,62 = 4.61,
p = 0.0358) and genotype (F1,62 = 14.78,
p = 0.0003); (
C) in the PFC SD significantly upregulates 5-HT2AR levels in WT, but not
Egr3−/−, mice (two-way ANOVA, sig. interaction between SD and genotype (F1,62 = 4.18,
p = 0.0451)). (
D) In the MPC, SD did not significantly increase 5-HT2AR levels; notably, 5-HT2ARs were lower in
Egr3−/− mice than WT under both basal (SDc) and SD conditions (two-way ANOVA, sig. main effect of genotype (F1,62 = 38.79,
p < 0.0001) but not of SD (F1,62 = 1.371,
p = 0.2461)). Representative 3H-M100907 autoradiography images of brain tissue sections from (
E) AFC, (
F) PFC, and (
G) MPC. For experiments in (
B–
D) WT: SDc,
n = 17; SD,
n = 16;
Egr3−/−: SDc,
n = 16; SD,
n = 17. Bonferroni-corrected comparisons: *
p < 0.05, **
p < 0.01, ***
p < 0.001. Values represent means ± SEM.
Full size image
These data reveal the novel finding that 5-HT2ARs can be upregulated in the PFC in a matter of hours in response to an environmental stimulus, and that this requires
Egr3. The results suggest that EGR3, an activity dependent IEG transcription factor, may directly regulate expression of
Htr2a in response to environmental events. For this to be happening, EGR3 would have to be expressed in the same cells as
Htr2a and EGR3 consensus binding sequences would have to be present in the
Htr2a promoter. Our prior study demonstrated that the former is true [
27]. To determine the other requirement, we used the FIMO program [
35] which revealed two high probability EGR3 binding sites in the
Htr2a promoter, a distal binding site at −2777 bp (site A, AGGAGGGGGAGTCT) and a proximal site at -61 bp (site B, GCGCGGGGGAGGGG) upstream of the start ATG (Fig.
4A).
Fig. 4: EGR3 binds to the Htr2a promoter in frontal cortex.
 (A)
(A) Schematic showing high probability EGR3 consensus binding sites in the
Htr2a promoter. (
B) Representative Western blot image (
n = 3 shown of
n = 11 per group, Chameleon Duo Pre-Stained Protein Ladder (Li-COR Biosciences)) and (
C) Western blot average protein levels, show significant upregulation of activity dependent EGR3 protein following 6 h of SD in WT frontal cortex (t20 = 4.778;
p = 0.0001;
n = 11 per group). (
D) ChIP-qPCR shows SD increases binding of EGR3 to
Arc promotor (positive control; SDc,
n = 8; SD,
n = 10) and
Htr2a distal promoter (SDc,
n = 9; SD,
n = 9), but not
Htr2a proximal promoter (SDc,
n = 9; SD,
n = 11), in frontal cortex tissue (t16 = 2.802;
p = 0.0128, t16 = 2.297;
p = 0.0354, and t18 = 0.8463;
p = 0.4085, respectively). Unpaired student’s
t test, *
p < 0.05, ***
p < 0.001. Values represent means ± SEM. (Abbreviations: rEGR3 recombinant EGR3 protein).
Full size image
To determine whether EGR3 protein binds to these sites in mouse cortex, we conducted chromatin immunoprecipitation (ChIP). As an IEG,
Egr3 is expressed in a stimulus dependent manner. Under basal, unstimulated conditions, levels of EGR3 protein in the brain are low, and little binding to the promoters of target genes would be expected. SD, which increases
Egr3 mRNA ([
26,
27] and Fig.
1), should increase EGR3 protein levels and, we expected, binding to the
Htr2a promoter. Fig.
4B–C show that 6 h of SD significantly increases EGR3 protein levels in the frontal cortex of WT mice, measured by Western blot. Next, we conducted ChIP on samples of chromatin from WT mice that underwent 6 h of SD compared to SDc mice. We used the promoter region of activity-regulated cytoskeleton associated protein (
Arc) that includes a validated EGR3 binding domain as a positive control [
36]. Fig.
4D shows that SD significantly increased EGR3 binding to the
Arc promoter region, as well as to the distal
Htr2a promoter, compared to SDc conditions. EGR3 binding to the proximal promoter was not significantly changed following SD.
To confirm that the binding of EGR3 to the
Htr2a promoter results in a change in gene expression, we conducted in vitro luciferase-reporter assays. We co-transfected neuro2a cells with luciferase/SEAP constructs driven by either the positive control
Arc promoter [
36], the distal
Htr2a promoter, or the proximal
Htr2a promoter, with either a CMV vector overexpressing EGR3, or a control empty CMV vector (Fig.
5A–C). Fig.
5D shows Western blot results validating EGR3 overexpression in the cell culture assays. We found that both regions of the
Htr2a promoter containing high-probability EGR3 binding sites (Fig.
4A) drive expression of luciferase in response to EGR3 expression. EGR3 expression induces a 4.9-fold increase in positive control
Arc promoter-driven luciferase (Fig.
5A) and 3.9-fold increase in the
Htr2a distal promoter-driven luciferase (Fig.
5B). In addition, although the proximal
Htr2a promoter did not show a statistically significant increase in EGR3 binding in the in vivo ChIP assay (Fig.
4D), in vitro expression of EGR3 induced a significant 4.2-fold increase in
Htr2a proximal promoter-driven luciferase signal, compared to CMV vector alone (Fig.
5C). These results suggest that the physiologic stimulus of SD upregulates EGR3, which directly binds to the
Htr2a promoter and activates
Htr2a expression, results in increased levels of cortical 5-HT2ARs in the mouse brain.
Fig. 5: EGR3 drives gene expression via binding sites in the Htr2a promoter and EGR3 and HTR2A expression is reduced in schizophrenia brains.
 (A
(A–
C) Schematics of dual luciferase/SEAP reporter constructs containing EGR3 consensus binding sites and results of in vitro assays in neuro2a cells. CMV-driven EGR3 overexpression significantly upregulates expression of luciferase reporters driven by (
A)
Arc promoter (t4 = 42.28;
p < 0.0001), (
B)
Htr2aD distal promoter (t4 = 21.17;
p < 0.0001), and (
C)
Htr2aP proximal promoter (t4 = 8.977,
p = 0.0009) regions. (
D) Western blot validation of EGR3 expression following transfection with CMV-EGR3 vs. CVM empty vector, from cultures expressing reporter constructs driven by promoters from
Arc,
Htr2aD,
Htr2aP, or negative promoter control vector. Unpaired student’s
t test, (
A–
D)
n = 3 per group. (
E,
F) EGR3 and
HTR2A mRNA levels are significantly decreased in human brain tissue samples from the prefrontal cortex of schizophrenia patients compared to controls. Microarray (Robust Multi-Array Average) gene expression data derived from NCBI Geo database GSE53987 showing significant decrease in (
E)
EGR3 (
U = 81,
p = 0.0331) expression and (
F)
HTR2A (
U = 63,
p = 0.0050) expression, in control (
n = 19) vs. schizophre
nia (
n = 15) patients. Mann–Whitney
U test, *
p < 0.05, **
p < 0.01, ***
p < 0.001, ****
p < 0.0001. Values represent means ± SEM. (Abbreviations: CMV cytomegalovirus, GLuc
Gaussia luciferase, SEAP secreted alkaline phosphatase).
Full size image
As discussed above, numerous studies have reported deficient levels of 5-HT2ARs in schizophrenia patients, as well as decreased levels of
HTR2A in postmortem patient brain tissue. If our findings showing that EGR3 regulates
Htr2a in mice are also true in humans, then the deficiency in
HTR2A expression in the brains of schizophrenia patients could be a consequence of reduced expression of
EGR3, a gene that has also been found to be reduced in schizophrenia patient brains. To further explore this possibility, we analyzed the results of a published gene expression dataset from postmortem prefrontal cortex tissue samples from schizophrenia patient and control brains in the NCBI GEO Database [
38]. Fig.
5E and F show that both
EGR3 and
HTR2A expression are reduced in the schizophrenia subject samples compared to controls.

 pubmed.ncbi.nlm.nih.gov

 www.ncbi.nlm.nih.gov