-
Neuroscience & Pharmacology Discussion Welcome Guest
Posting Rules Bluelight Rules Recent Journal Articles Chemistry Mega-Thread FREE Chemistry Databases! Self-Education Guide -
N&PD Moderators: Skorpio
You are using an out of date browser. It may not display this or other websites correctly.
You should upgrade or use an alternative browser.Ketamine salts solubility
- Thread starter fastandbulbous
- Start date
- Status
- Not open for further replies.


simstim
Bluelighter
- Joined
- Apr 20, 2021
- Messages
- 6,601
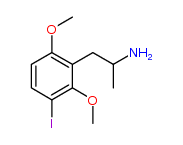
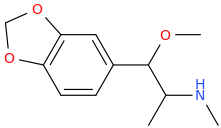
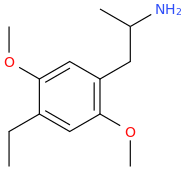
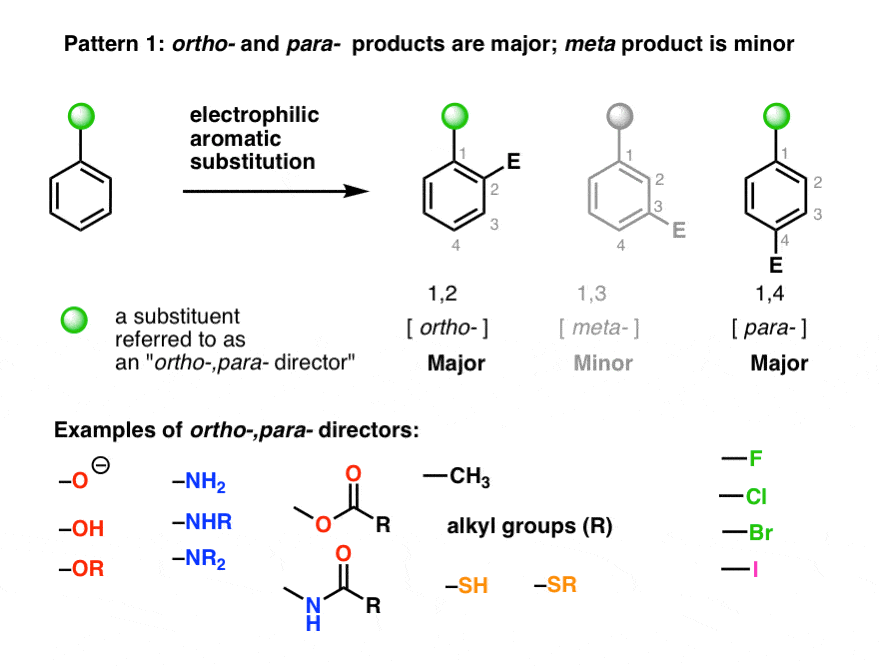
3-Iodo-2,6-dimethoxy-amphetamine
Shulgin didn't name this but I call it iso-DOI because it's the arrangement I would pick if I were looking for the next best thing to DOI (and DOB, DOM, DOC, ETC.
I would expect the 3,2,6 substitution pattern is closest to 4,2,5. Also, 3,4,5 substitution should be active but if it's possible to manufacture with a halogen or not I dunno. I think when you start with 3,5-DMA it might get halogenated at the 2 position which is not ideal.
It's too bad we can't get 4-bromo-3,5-DMA. I bet it would be active like mescaline or more likely DESOXY mescaline (the 3,5-DMA version of DOM). It's way more potent than TMA or mescaline. Less potent than DOM.Thanks to @crispy for the heads up on this one!
Acute sleep deprivation upregulates serotonin 2A receptors in the frontal cortex of mice via the immediate early gene Egr3
Blow by blow of results and my thoughts
The researchers found that sleep deprivation increases both gene transcription and protein levels of 5HT2A receptors, via the production of the transcription factor Egr3.
They first found that sleep deprivation induces Egr3 mRNA expression. Next they found via mRNA and protein analysis that sleep deprivation increases 5HT2A receptor density (and Egr3 knockout abolishes this effect). Then they find this effect is localized to the prefrontal cortex. Finally they map the regions on the 5HT2A gene that Egr3 binds to and demonstrate binding at those sites causes 5HT2A receptor expression. Finally they demonstrate both lower Egr3 and 5HT2A mRNA expression in brains of schizoprenic patients
This paper demonstrates an increase in 5HT2A after sleep deprivation and makes the claim that it is a compensatory reaction possibly to ameliorate the memory deficits accured by sleep deprivation. (they cite papers that demonstrate importance of 5HT2A in memory acquisition, and papers that show Egr3 knockout mice have impaired memory - they keep sniffing littermates because they dont remember em).
The link with schizophrenia is quite interesting. The paper claims that schizophrenic individuals will be more affected by sleep deprivation due to less compensatory 5HT2A expression. This goes along with previous findings that there are fewer 5HT2A receptors in post mortem brains of schizophrenic individuals . Interestingly the pharmacological crux of second generation antipsychotics is 5HT2A antagonism - I would not have guessed that 5HT2A signaling is hypoactive in this population. If anybody has any thoughts on this, Id love to hear em.
Words of paper below for those without access. I had to trim out the abstract, methods, and references to fit the 1 post character limit. Let me know if you would like me to post them separately.
Introduction
The serotonin 2A receptor (5-HT2AR) is extensively expressed in the cerebral cortex where it is believed to play a critical role in perception, cognition, and psychosis. Much of the evidence for this comes from studies on the effects of drugs that bind to the 5-HT2AR [1,2,3]. This includes agonists, such as lysergic acid (LSD), psilocybin, and mescaline, which cause hallucinations [4,5,6], as well as antagonists and inverse agonists, including second-generation antipsychotics, which reverse the perceptual disturbances of psychiatric illnesses such as schizophrenia [6,7,8]. Additional findings supporting a role for the 5-HT2AR in the symptoms of psychosis include a long history of studies showing abnormal levels of 5-HT2ARs in the brains of patients diagnosed with schizophrenia. While some studies did not detect differences [9,10,11], and one group identified increased levels [12, 13], the vast majority of these studies, including a meta-analysis [14], have revealed reduced 5-HT2AR levels in schizophrenia subjects. These include post-mortem studies measuring 5-HT2AR ligand binding and mRNA expression, and as well as in vivo Positron Emission Tomography (PET) scan investigations [14,15,16,17,18,19,20,21,22,23,24]. Notably, studies in antipsychotic-naïve patients indicate that the reduction in 5-HT2AR levels is not simply a consequence of medication treatment [16, 18]. Despite the longstanding recognition of the importance of 5-HT2ARs in the response to psychedelic drugs, and the symptoms and treatment of psychotic disorders, the processes that regulate expression of this critical receptor remain unknown.
Our prior work identified that mice lacking the immediate early gene (IEG) Egr3 (Egr3−/− mice) have reduced levels of 5-HT2ARs in the frontal cortex [25]. This suggested that Egr3 is required for expression of Htr2a, the gene that encodes the 5-HT2AR. If so, we reasoned that stimuli that activate expression of Egr3 may also induce Htr2a expression. Sleep deprivation (SD) is a physiological stimulus that upregulates Egr3 in the mouse cerebral cortex [26]. Using this approach, we found that just six hours of SD increases Htr2a mRNA levels in the mouse cortex and, moreover, this required Egr3 [27].
This discovery that Htr2a expression can be rapidly induced in the rodent brain in response to a physiologic stimulus is supported by a prior study in humans. In 2012 Elmenhorst and colleagues reported that preventing healthy subjects from sleeping for a period of 24 h resulted in a significant increase in 5-HT2AR binding in the neocortex, detected on PET scan [28].
These findings raised the question of whether EGR3, an activity dependent transcription factor, directly regulates the Htr2a gene, and thereby mediates the environmental induction of Htr2a mRNA in the cortex. In the current study we have addressed the questions of where in the cerebral cortex SD is inducing Htr2a expression, does this also result in increased 5-HT2AR protein, and is EGR3 directly regulating the Htr2a gene to effect this environmentally-induced receptor expression. We show that six hours of SD significantly upregulates Htr2a in the prefrontal cortex and adjacent sensorimotor cortex and that 8 h of SD upregulates 5-HT2AR levels in the same regions. In both cases this upregulation requires Egr3. Further, we show that the EGR3 protein binds to the Htr2a promoter in vivo and drives expression of an in vitro reporter construct, suggesting that the activity dependent IEG transcription factor EGR3 directly regulates expression of Htr2a in response to the acute environmental stimulus of SD.
Results
We had previously reported that SD rapidly upregulates Htr2a expression in the mouse cortex [27]. However, since this study was performed in cortical homogenates, it was unclear in what cortical regions this upregulation was taking place. This is important since levels of both Htr2a mRNA and 5-HT2AR protein display a distinctive anterior-posterior gradient in the rodent cortex [40,41,42]. This raised the question of whether SD was increasing Htr2a expression in regions where the receptor is already expressed or inducing it de novo in regions where it is normally not expressed. We therefore examined the cortical region in which SD induces Htr2a expression.
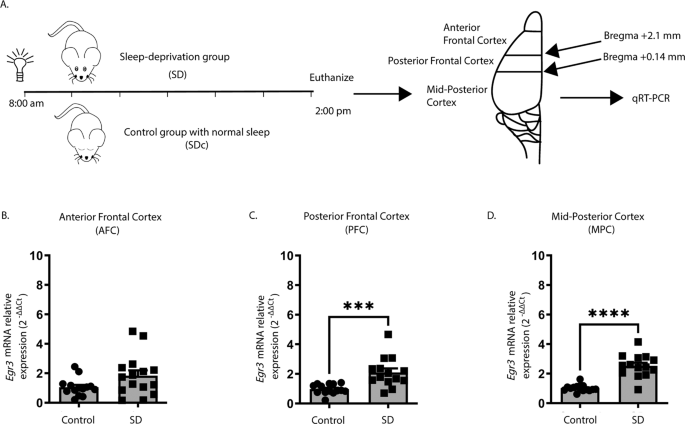
We first tested whether we could replicate published in situ hybridization findings showing that SD upregulates Egr3 [26] using quantitative reverse transcription (qRT) PCR. Fig. 1A shows the SD protocol and coordinates for regional brain dissection. In WT mice, we found that 6 h of SD did not increase Egr3 expression in the most anterior region of frontal cortex (AFC) but did significantly upregulate Egr3 mRNA in the posterior part of the frontal cortex (PFC), as well as in more posterior regions of cortex (labeled “mid-posterior cortex” (MPC)) (Fig. 1B–D).
Fig. 1: Sleep deprivation upregulates Egr3 in a region-dependent manner in the frontal cortex.

(A) SD protocol. In WT mice quantitative RT-PCR shows that 6 h of SD (B) does not increase Egr3 expression in AFC regions (t27 = 1.956; p = 0.0609; SDc, n = 14; SD, n = 15), but significantly upregulates Egr3 mRNA in (C) PFC (t26 = 3.979, p = 0.0005; SDc, n = 14; SD, n = 14) and (D) MPC (t27 = 7.307; p < 0.0001; SDc, n = 15; SD, n = 14) regions, compared to SDc. Unpaired student’s t test, ***p < 0.001, ****p < 0.0001. Values represent means ± SEM. (Abbreviations: AFC anterior frontal cortex; PFC posterior frontal cortex; MPC mid to posterior cortex; SD sleep deprivation; SDc SD control; WT wildtype; h hours).
Full size image
We next examined whether 6 h of SD can upregulate Htr2a expression in the same cortical regions, and whether this requires Egr3 (Fig. 2A–C). In the AFC, SD increased Htr2a expression when both genotypes were analyzed together (two-way ANOVA), but not in either WT or Egr3−/− groups independently (post-hoc analyses were not significant) (Fig. 2A). However, in the PFC of WT mice, SD significantly increased Htr2a mRNA compared to SDc, a result that was absent in Egr3−/− mice (Fig. 2B). In the MPC, SD also increased Htr2a mRNA in WT mice, though the relative amount of the increase was less than in the PFC. Again, this effect did not occur in Egr3−/− mice (Fig. 2C).
Fig. 2: Sleep deprivation upregulates Htr2a in an Egr3-dependent, and region-specific, manner.

(A–C) In WT and Egr3−/− mice qRT-PCR shows that 6 h of SD (A) increases Htr2a overall in the AFC when both genotypes were analyzed (two-way ANOVA, sig. main effect of SD (F1,50 = 8.279, p = 0.0059; WT: SDc, n = 15; SD, n = 14; Egr3−/−: SDc, n = 12; SD, n = 13)) but not in either genotype alone (post-hoc analyses showed no sig. differences between genotypes or SD conditions). (B) However, SD significantly upregulates Htr2a expression in the PFC of WT, but not Egr3−/−, mice, compared to SDc (two-way ANOVA, sig. main effect of SD (F 1,53 = 12.08, p = 0.0010; WT: SDc, n = 15; SD, n = 15; Egr3−/−: SDc, n = 12; SD, n = 15); post-hoc analyses showed a sig. increase of Htr2a mRNA after SD (vs. SDc) in WT mice (p = 0.0088), but not in the Egr3−/− mice (p = 0.6777)). (C) In the MPC, SD increased Htr2a in WT, but not Egr3−/−, mice, compared to SDc (two-way ANOVA, sig. main effect of SD (F 1,47 = 13.14, p = 0.0007; WT: SDc, n = 15; SD, n = 14; Egr3−/−: SDc, n = 10; SD, n = 12)); post-hoc analyses showed sig. increase of Htr2a mRNA after SD (vs. SDc) in WT mice (p = 0.0205) but not in the Egr3−/− mice (p = 0.2343). (D) Representative images from n = 3 per group of RNAscope in situ hybridization demonstrating Htr2a expression in SDc and SD WT and Egr3−/− mice. Bonferroni-corrected comparisons: *p < 0.05, **p < 0.01. Values represent means ± SEM.
Full size image
To further characterize the regional distribution of Htr2a expression in response to SD, and in the absence of Egr3, we conducted RNAscope in situ hybridization. Fig. 2D shows that 6 h of SD increases Htr2a expression in WT mice in a region-specific manner. Compared to WT mice, Egr3−/− mice have lower levels of Htr2a mRNA throughout most of the cortex, sparing selected brain regions. SD may produce small increases in some regions of Egr3−/− mice, though this is less consistent than in WT mice.
In WT mice that did not undergo SD (SDc), RNAscope in situ hybridization showed a distribution pattern of Htr2a mRNA similar to prior studies in rats using radioactive in situ hybridization [40, 41]. This includes high levels of expression in the anterior frontal cortex, particularly in a thin layer (L) of cells at the L1/L2 border and in the deep L2/3–L5 (L4 not present in anterior frontal cortex), with relatively lower signal in L6a. Also consistent with prior studies, Htr2a mRNA levels decrease with progression toward more posterior cortical regions, with notable reductions in L2/3, less drastic reductions in expression in L5, overall minimal L6a expression, and strong expression in L6b bordering the corpus callosum. In the posterior frontal cortex (Bregma +2.1–+0.14) expression of Htr2a is present in L2/3 in the somatomotor areas (MOs, MOp) and medial somatosensory cortex (SSp), but notably absent from the lateral SSp, and supplementary somatosensory cortex (SSs), with posterior progression. This absence of Htr2a in L2/3 in the SSp/s is evident in prior studies in rat as well [40, 41].
In areas outside of the cortex, Htr2a expression in WT SDc animals is seen in the piriform cortex (PIR), olfactory tubercle (OT), taenia tecta dorsal and ventral (TTd/TTv), anterior olfactory nucleus (AON), and substantia innomata (SI) with strong expression in the claustrum (CL) and endopiriform cortex (dorsal) (EPd). Low level Htr2a expression is also seen in patches in the caudate/putamen (CP) as well as in the lateral and medial septum (LS, MS). Low level expression is also seen in the hypothalamus.
Following sleep deprivation in WT mice, the overall level of Htr2a in the anterior frontal cortex (anterior to Bregma +2.1) does not appear to be increased compared to SDc, however the laminar distribution that is apparent in SDc animals becomes less clearly delineated, suggesting a potential increase in expression in some regions and decrease in expression in others. In contrast to the cortex, in this anterior part of the brain SD produces a marked increase in expression in the olfactory regions, including the AON, OT, as well as the PIR (particularly the pyramidal layer, PIR2), EPd, and TTd & TTv, compared to WT SDc mice.
In the PFC (Bregma +2.1–+0.14) SD increases overall Htr2a expression in WT mice, while also resulting in a more diffuse pattern, with loss of clear laminar signal, compared to SDc. Cortical areas in which SD produces the greatest increases in Htr2a levels include the anterior cingulate (ACAv, ACAd), & somatomotor areas (MOs, MOp), as well as more lateral regions, including the agranular insular area (AI). Notably, Htr2a expression in L6b is unchanged or only slightly increased by SD in WT mice. SD induces diffuse Htr2a expression in the CP, and potentially small increases in the MS and hypothalamus (this was not consistent across different animals in the same group).
Compared with WT mice, in Egr3−/− mice that did not undergo SD (SDc) Htr2a expression is reduced throughout the cortex, an effect that becomes more pronounced with progression in the posterior direction. The exceptions to this Egr3-depencence of Htr2a expression are the cells in L6b, as well as in the CL and EP and PIR, in which expression is only mildly reduced in Egr3−/− mice. Despite the reduced expression, a clear laminar distribution remains in the SDc mice, with most of the residual cortical expression in L5 & L4, and almost no expression evident in L2/3.
Despite the reduced expression of Htr2a in Egr3−/− mice, SD does appear to increase Htr2a mRNA in some brain regions of these animals. This induction is not consistently seen in the anterior frontal cortex but is clear in more posterior cortical regions (most evident in the ACA and MO, the same regions where SD increases expression in WT mice). L6b expression is only mildly increased, if at all, by SD in Egr3−/− mice. In regions outside of the cortex, SD increases Htr2a expression in the EPd, PIR, TT, AON, and OT, in Egr3−/− mice, though not to the levels seen in WT mice. Expression in the CL is not obviously affected by SD in Egr3−/− mice.
To determine if SD also increases 5-HT2AR protein levels, we performed receptor autoradiography with the selective 5-HT2AR antagonist 3H-M100907 on brain sections from WT and Egr3−/− mice at baseline and following 8 h SD (to allow time for translation of mRNA) (Fig. 3A). We found that, in the AFC, SD results in an overall increase in 5-HT2AR binding that differs between genotypes, but this increase is not significant in either WT or Egr3−/− genotypes alone (Fig. 3B). However, SD increases WT expression sufficiently to produce a significant difference in 5-HT2AR levels between WT and Egr3−/− mice that is not present in SDc animals (Fig. 3B, comparison between WT and Egr3−/− in the SD groups). In the PFC, 8 h of SD significantly increases 5-HT2AR levels in WT mice but not in Egr3−/− mice (Fig. 3C). In addition, 5-HT2AR levels are significantly greater in WT than Egr3−/− mice in this region both at baseline (replicating our prior radioligand binding assay findings [25]), and following SD. In the MPC, where endogenous Htr2a expression is lower than in more anterior cortical regions, SD does not increase 5-HT2AR levels in WT or Egr3−/− mice (Fig. 3D), and levels of 5-HT2AR are lower in Egr3−/− mice than WT mice at baseline and following SD. Fig. 3E–G show representative autoradiographic images from WT and Egr3−/− mice under SDc and SD conditions.
Fig. 3: SD increases 5-HT2AR levels in the PFC of WT mice in an Egr3-dependent manner.

(A) 8 h SD protocol. Quantification of 3H-M100907 binding autoradiography shows that SD, compared with SDc: (B) in AFC results in significantly greater 5-HT2AR levels in WT mice than Egr3−/− mice after SD (two-way ANOVA, sig. main effects of SD (F 1,62 = 4.61, p = 0.0358) and genotype (F1,62 = 14.78, p = 0.0003); (C) in the PFC SD significantly upregulates 5-HT2AR levels in WT, but not Egr3−/−, mice (two-way ANOVA, sig. interaction between SD and genotype (F1,62 = 4.18, p = 0.0451)). (D) In the MPC, SD did not significantly increase 5-HT2AR levels; notably, 5-HT2ARs were lower in Egr3−/− mice than WT under both basal (SDc) and SD conditions (two-way ANOVA, sig. main effect of genotype (F1,62 = 38.79, p < 0.0001) but not of SD (F1,62 = 1.371, p = 0.2461)). Representative 3H-M100907 autoradiography images of brain tissue sections from (E) AFC, (F) PFC, and (G) MPC. For experiments in (B–D) WT: SDc, n = 17; SD, n = 16; Egr3−/−: SDc, n = 16; SD, n = 17. Bonferroni-corrected comparisons: *p < 0.05, **p < 0.01, ***p < 0.001. Values represent means ± SEM.
Full size image
These data reveal the novel finding that 5-HT2ARs can be upregulated in the PFC in a matter of hours in response to an environmental stimulus, and that this requires Egr3. The results suggest that EGR3, an activity dependent IEG transcription factor, may directly regulate expression of Htr2a in response to environmental events. For this to be happening, EGR3 would have to be expressed in the same cells as Htr2a and EGR3 consensus binding sequences would have to be present in the Htr2a promoter. Our prior study demonstrated that the former is true [27]. To determine the other requirement, we used the FIMO program [35] which revealed two high probability EGR3 binding sites in the Htr2a promoter, a distal binding site at −2777 bp (site A, AGGAGGGGGAGTCT) and a proximal site at -61 bp (site B, GCGCGGGGGAGGGG) upstream of the start ATG (Fig. 4A).
Fig. 4: EGR3 binds to the Htr2a promoter in frontal cortex.

(A) Schematic showing high probability EGR3 consensus binding sites in the Htr2a promoter. (B) Representative Western blot image (n = 3 shown of n = 11 per group, Chameleon Duo Pre-Stained Protein Ladder (Li-COR Biosciences)) and (C) Western blot average protein levels, show significant upregulation of activity dependent EGR3 protein following 6 h of SD in WT frontal cortex (t20 = 4.778; p = 0.0001; n = 11 per group). (D) ChIP-qPCR shows SD increases binding of EGR3 to Arc promotor (positive control; SDc, n = 8; SD, n = 10) and Htr2a distal promoter (SDc, n = 9; SD, n = 9), but not Htr2a proximal promoter (SDc, n = 9; SD, n = 11), in frontal cortex tissue (t16 = 2.802; p = 0.0128, t16 = 2.297; p = 0.0354, and t18 = 0.8463; p = 0.4085, respectively). Unpaired student’s t test, *p < 0.05, ***p < 0.001. Values represent means ± SEM. (Abbreviations: rEGR3 recombinant EGR3 protein).
Full size image
To determine whether EGR3 protein binds to these sites in mouse cortex, we conducted chromatin immunoprecipitation (ChIP). As an IEG, Egr3 is expressed in a stimulus dependent manner. Under basal, unstimulated conditions, levels of EGR3 protein in the brain are low, and little binding to the promoters of target genes would be expected. SD, which increases Egr3 mRNA ([26, 27] and Fig. 1), should increase EGR3 protein levels and, we expected, binding to the Htr2a promoter. Fig. 4B–C show that 6 h of SD significantly increases EGR3 protein levels in the frontal cortex of WT mice, measured by Western blot. Next, we conducted ChIP on samples of chromatin from WT mice that underwent 6 h of SD compared to SDc mice. We used the promoter region of activity-regulated cytoskeleton associated protein (Arc) that includes a validated EGR3 binding domain as a positive control [36]. Fig. 4D shows that SD significantly increased EGR3 binding to the Arc promoter region, as well as to the distal Htr2a promoter, compared to SDc conditions. EGR3 binding to the proximal promoter was not significantly changed following SD.
To confirm that the binding of EGR3 to the Htr2a promoter results in a change in gene expression, we conducted in vitro luciferase-reporter assays. We co-transfected neuro2a cells with luciferase/SEAP constructs driven by either the positive control Arc promoter [36], the distal Htr2a promoter, or the proximal Htr2a promoter, with either a CMV vector overexpressing EGR3, or a control empty CMV vector (Fig. 5A–C). Fig. 5D shows Western blot results validating EGR3 overexpression in the cell culture assays. We found that both regions of the Htr2a promoter containing high-probability EGR3 binding sites (Fig. 4A) drive expression of luciferase in response to EGR3 expression. EGR3 expression induces a 4.9-fold increase in positive control Arc promoter-driven luciferase (Fig. 5A) and 3.9-fold increase in the Htr2a distal promoter-driven luciferase (Fig. 5B). In addition, although the proximal Htr2a promoter did not show a statistically significant increase in EGR3 binding in the in vivo ChIP assay (Fig. 4D), in vitro expression of EGR3 induced a significant 4.2-fold increase in Htr2a proximal promoter-driven luciferase signal, compared to CMV vector alone (Fig. 5C). These results suggest that the physiologic stimulus of SD upregulates EGR3, which directly binds to the Htr2a promoter and activates Htr2a expression, results in increased levels of cortical 5-HT2ARs in the mouse brain.
Fig. 5: EGR3 drives gene expression via binding sites in the Htr2a promoter and EGR3 and HTR2A expression is reduced in schizophrenia brains.

(A–C) Schematics of dual luciferase/SEAP reporter constructs containing EGR3 consensus binding sites and results of in vitro assays in neuro2a cells. CMV-driven EGR3 overexpression significantly upregulates expression of luciferase reporters driven by (A) Arc promoter (t4 = 42.28; p < 0.0001), (B) Htr2aD distal promoter (t4 = 21.17; p < 0.0001), and (C) Htr2aP proximal promoter (t4 = 8.977, p = 0.0009) regions. (D) Western blot validation of EGR3 expression following transfection with CMV-EGR3 vs. CVM empty vector, from cultures expressing reporter constructs driven by promoters from Arc, Htr2aD, Htr2aP, or negative promoter control vector. Unpaired student’s t test, (A–D) n = 3 per group. (E, F) EGR3 and HTR2A mRNA levels are significantly decreased in human brain tissue samples from the prefrontal cortex of schizophrenia patients compared to controls. Microarray (Robust Multi-Array Average) gene expression data derived from NCBI Geo database GSE53987 showing significant decrease in (E) EGR3 (U = 81, p = 0.0331) expression and (F) HTR2A (U = 63, p = 0.0050) expression, in control (n = 19) vs. schizophrenia (n = 15) patients. Mann–Whitney U test, *p < 0.05, **p < 0.01, ***p < 0.001, ****p < 0.0001. Values represent means ± SEM. (Abbreviations: CMV cytomegalovirus, GLuc Gaussia luciferase, SEAP secreted alkaline phosphatase).
Full size image
As discussed above, numerous studies have reported deficient levels of 5-HT2ARs in schizophrenia patients, as well as decreased levels of HTR2A in postmortem patient brain tissue. If our findings showing that EGR3 regulates Htr2a in mice are also true in humans, then the deficiency in HTR2A expression in the brains of schizophrenia patients could be a consequence of reduced expression of EGR3, a gene that has also been found to be reduced in schizophrenia patient brains. To further explore this possibility, we analyzed the results of a published gene expression dataset from postmortem prefrontal cortex tissue samples from schizophrenia patient and control brains in the NCBI GEO Database [38]. Fig. 5E and F show that both EGR3 and HTR2A expression are reduced in the schizophrenia subject samples compared to controls.
Discussion
The results we report here reveal several novel mechanisms of how 5-HT2AR levels in the brain are regulated. Our findings demonstrate that a physiological stimulus, SD, rapidly upregulates expression of both Htr2a expression and levels of membrane bound 5-HT2AR in the mouse brain in a matter of several hours. They also demonstrate that this environmentally induced upregulation requires the activity dependent IEG transcription factor EGR3, which binds to the Htr2a promoter in the frontal cortex in vivo and is able to activate expression of Htr2a promoter-driven reporter constructs in vitro. Thus, these results identify a direct transcriptional regulator of the 5-HT2AR in the frontal cortex and reveal a previously unrecognized characteristic of 5-HT2AR regulation; that it is environmental-stimulus responsive.
Our finding that 5-HT2ARs can be rapidly upregulated in the mouse frontal cortex in response to SD is supported by a study in humans that employed a similar stimulus. Elmenhorst and colleagues conducted a PET study using the 5-HT2AR selective radioligand [18F]altanserin to determine the effects on 24 h of SD on 5-HT2AR levels in the frontal cortex of healthy subjects. Comparing PET scans conducted following a night of normal sleep to scans conducted the following day, after 24 h of total sleep deprivation, they found a 9.6% increase of [18F]altanserin binding in neocortical regions, including the medial inferior frontal gyrus, insula, and anterior cingulate, parietal, sensomotoric, and ventrolateral prefrontal cortices [28]. Their study was the first investigation of the effects of SD on cerebral cortex 5-HT2AR levels in either humans or animals [28]. In discussing the possible mechanisms that may underlie their finding, the authors point to the fact that SD increases brain levels of serotonin (5-HT) in rodents [43]. However, the effects of serotonin, and other agonists, on 5-HT2AR levels are complicated, with reports showing both upregulation and downregulation in different systems and in a manner that may be influenced by concentration or dosage [44]. Our findings suggest, instead, that this increase in 5-HT2AR levels may result from direct upregulation of Htr2a by the IEG EGR3, which has been shown to be activated in the cortex of mice by 6 h of SD by the Allen Institute for Brain Research group [26] and replicated by our laboratory here and in our prior study [27].
We chose to use SD as a stimulus in the current study because it is an environmental intervention that we and others have shown increases Egr3 expression [26, 27] and thus allowed us to test our hypothesis that induction of EGR3 should upregulate expression of Htr2a. As a class, IEGs are activated in the brain in response to a wide range of stimuli, including many types of stress [45]. However, the expression of Egr3 in response to specific stressors has been less well investigated than that of many other IEGs. So, regardless of whether SD causes mice to experience “stress”, it is an effective intervention that demonstrates how rapidly an environmental stimulus can upregulate 5-HT2AR mRNA and protein levels in the brain; in just 6–8 h.
Roles of 5-HT2ARs and Egr3 in stress response and memory
A significant body of research has suggested that stress influences 5-HT2AR expression. Numerous types of stress, including physical stressors of immobilization, chronic forced swimming and toe pinch, social stress, including maternal separation, as well as in utero exposure to lipopolysaccharide (to mimic bacterial infection), have been found to elevate levels of 5-HT2AR mRNA and protein, as well as to increase the frequency of 5-HT2AR-mediated behaviors (head-twitch response to 5-HT2AR agonists) (reviewed in Table 1 of [46]). Though not all types of stress produce this effect [46]. These findings suggest that increased expression of 5-HT2ARs may play a role in the brain’s response to environmental events, particularly stressful ones.
One of the critical responses of the brain to environmental events is the formation of memories. In fact, numerous studies suggest a role for 5-HT2ARs in memory formation. 5-HT2ARs facilitate associative learning (reviewed in Table 2 of [46]), play a role in the retrieval of recognition memory [47], and modulate reconsolidation of contextual recognition memory [48]. If EGR3 is regulating the increase in 5-HT2ARs expression in response to environmental stimuli, this suggests that the Egr3 gene should also be required for memory formation. In fact, our prior studies showed that Egr3 deficient (−/−) mice fail to habituate to a startling stimulus (demonstrating deficits in associative memory), display social interaction responses consistent with an inability to remember familiar mice (including persistent, non-habituating social investigation and increased aggressive behavior), and show deficits in Y-maze navigation indicative of defects in spatial memory formation [49].
We also found that Egr3−/− mice show a heightened response to stress [49]. While at first this may appear inconsistent with the literature indicating that 5-HT2ARs are upregulated in response to stress, the findings are actually aligned. Without Egr3, mice fail to remember having experienced events, such as being handled by an investigator or having encountered mice they have lived with their whole lives, and they respond with the same high level of reactivity, and cortisol release, as mice being exposed for the first time [49]. Thus, the findings that increased 5-HT2AR levels are important for associative and contextual learning, and the fact that Egr3−/− mice have deficient levels of 5-HT2AR that fail to normally upregulate in response to environmental stimuli ([25, 27] and current results), provide a potential explanation for at least part of the heightened stress response of Egr3−/− mice [49]. More research will be necessary to determine if Egr3 mediates the change in 5-HT2AR levels in response to other types of stress.
Regulation of Htr2a expression
Studies examining the mechanisms by which 5-HT2AR levels are regulated have largely focused on effects of agonist and antagonist actions. These studies demonstrate the complex nature of 5-HT2AR regulation. The endogenous ligand 5-HT, as well as both agonists and antagonists, can trigger rapid internalization of 5-HT2ARs [44, 50, 51]. Though some studies have found that specific agonists can induce processes such as receptor desensitization without altering surface density [52], and other studies have shown a paradoxical increase in receptor density following antagonist exposure in specific cell types [53].
Yet, little is known about transcriptional regulation of Htr2a, or that environmental stimuli rapidly alter 5-HT2AR levels. One study employed bioinformatic resources and structural equation modeling to analyze the putative effect of a polymorphism in the human HTR2A promoter on transcription factor binding in subjects with chronic fatigue syndrome [54]. Their findings suggested a diagnosis-specific interaction between methylation of an E47 transcription factor binding site and HTR2A expression levels in peripheral blood mononuclear cells in a manner influenced by cortisol level. However, the functionality of these transcription factor binding sites was not examined in that study [54]. Thus, our findings are novel in identifying direct regulation of Htr2a by an activity dependent IEG.
5-HT2ARs in schizophrenia
5-HT2ARs are abundantly expressed in the neocortex and play important roles in cognition, mood and sleep, processes that are disrupted across numerous psychiatric disorders. Investigations of drugs that act as agonists at 5-HT2ARs have recently experienced a resurgence in the search for treatments for severe psychiatric symptoms ranging from depression [55] to anxiety disorders such as PTSD [56,57,58]. Yet decades of clinical practice and research have demonstrated a particular importance of 5-HT2ARs in schizophrenia.
Schizophrenia is characterized by abnormalities in perception, thinking and memory (exemplified by hallucinations, delusions and cognitive deficits). The fact that 5-HT2ARs mediate the hallucinogenic effects of numerous drugs including LSD, psilocybin, and mescaline [5, 6] suggest the possibility that this receptor may also influence the hallucinations and perceptual disturbances of schizophrenia. One of the most important discoveries that demonstrated a critical role for 5-HT2ARs in schizophrenia symptomatology was the discovery that clozapine, one of the most effective antipsychotic medications to date, binds with high affinity to this receptor [59]. In fact, 5-HT2AR binding is an essential feature of second-generation antipsychotics, which were modeled after clozapine and are the first-line of treatment for psychotic disorders [8, 59]. Furthermore, the 5-HT2AR inverse agonist pimavanserin is effective for treatment of psychosis [7]. Finally, as far back as 1976, numerous post-mortem and in vivo studies have revealed that 5-HT2AR (or 5-HT2R) levels are reduced in schizophrenia patients’ brains, and specifically in the prefrontal cortex [14, 15, 19, 22, 60, 61].
The prefrontal cortex has long been hypothesized to be a central brain region involved in schizophrenia pathogenesis [62, 63]. Activity in this region is essential for spatial working memory, dysfunction in which may contribute to the cognitive deficits that characterize schizophrenia (reviewed in [64]). Our results show that the environmental stimulus of SD increases levels of Egr3 and 5-HT2AR mRNA and protein in the antero-posterior domains of mouse cortex corresponding to the human prefrontal cortex, particularly the anterior cingulate cortex (ACAv, ACAd) [65]. These are also regions where we found that SD-induced 5-HT2AR expression is Egr3-dependent.
The fact that this process is mediated by an activity-dependent IEG transcription factor suggests the intriguing possibility that the reduced 5-HT2AR levels reported in schizophrenia patients may be a consequence of disrupted neural activity, resulting in insufficient activation of IEGs including EGR3. Such a hypothesis is intriguing in the context of recent findings that neural circuit connectivity, and the synchrony of neural oscillations, between the prefrontal cortex and other brain regions is disrupted in schizophrenia patients [66,67,68]. It is also supported by findings of abnormal IEG expression in patients’ brains ([69] and Fig. 5E).
In further support of this hypothesis, numerous EGR family genes are associated with risk for schizophrenia [70, 71]. Although genome wide association studies (GWAS) have recently identified numerous loci believed to increase genetic risk for illnesses like schizophrenia, the mechanism by which environment may interact with these regions remains elusive. It is notable that, EGR1, EGR4, and NAB2 (a transcriptional co-regulator that alters gene expression via binding to the EGRs) each map to one of the 145 GWAS loci for schizophrenia [71]. Although EGR3 itself is not within a GWAS locus, it interacts in co-regulatory feedback loops with the EGRs and NAB2 [70, 72], and EGR3 expression is reduced in the brains of schizophrenia patients [73, 74], including in our analyses of data from the NCBI GEO database, which shows reduced levels of both EGR3 and HTR2A mRNA in the prefrontal cortex of schizophrenia patients compared with controls (Fig. 5E, F) [38].
Another feature of schizophrenia, although less commonly discussed, is sleep disruption, which includes fragmentation and overall decreased duration of sleep [75, 76]. Our finding that SD increases expression of Egr3 and 5-HT2AR mRNA and protein may initially appear inconsistent with the numerous reports that expression of these genes is reduced in schizophrenia patients, since sleep disruption and loss is a common characteristic of this mental illness [75, 76]. There could be several explanations for this. First, as an IEG, expression of Egr3 is rapidly increased in response to a stimulus and returns to baseline within hours of the stimulus [77]. So, the timing of the study, or time of death (in the case of post-mortem studies), may influence whether the gene expression consequences of sleep disruption will still be detectable. However, an explanation we feel is more likely is that the altered neural activity in the prefrontal cortex of schizophrenia patients, which may be related to documented deficiencies in synaptic density [78] and abnormal circuit function [64, 66,67,68], could result in deficient induction of EGR3 in response to environmental stimuli, including SD. Our data suggest this would consequently result in deficient upregulation of 5-HT2ARs. Finally, genetic variations that affect expression of EGR family genes may also reduce the stimulus-dependent upregulation of 5-HT2ARs. The literature suggesting that this upregulation plays an important role in contextual and associative memory formation [46] suggests that such insufficient 5-HT2AR expression might contribute to the cognitive deficits of schizophrenia.
Together, these findings suggest that dysfunction in activity dependent EGR family IEGs, which include, and result in, decreased activity of EGR3, may contribute to the reported deficits in 5-HT2AR expression in schizophrenia patient brains. These findings thereby shed light on a potential mechanism whereby environment interacts with genetic variations to influence neurobiology that may contribute to the symptoms, and treatment, of neuropsychiatric illness.
Acute sleep deprivation upregulates serotonin 2A receptors in the frontal cortex of mice via the immediate early gene Egr3 - Molecular Psychiatry
Serotonin 2A receptors (5-HT2ARs) mediate the hallucinogenic effects of psychedelic drugs and are a key target of the leading class of medications used to treat psychotic disorders. These findings suggest that dysfunction of 5-HT2ARs may contribute to the symptoms of schizophrenia, a mental... www.nature.com

izo
Bluelighter
I think when you start with 3,5-DMA it might get halogenated at the 2 position which is not ideal.
Is suspect the two meo groups to be stronger directing than the aminoalkyl sidechain, so my bet wou be That Halogens and to the 4, but im just guessing.
4meSM
Bluelighter
Methoxy is a ortho and para directing group, so no, the halogen wouldn't go into the meta position (position 4, which in this case would be at the opposite side of the alkyl chain).Is suspect the two meo groups to be stronger directing than the aminoalkyl sidechain, so my bet wou be That Halogens and to the 4, but im just guessing.
izo
Bluelighter
So n-methyl Britney spears is Brad Pitt?
izo
Bluelighter
Don’t let him know.iChemLabs | Store
iChemLabs is a scientific software company that creates affordable and easy to use chemistry software. We create the popular brand of ChemDoodle chemical drawing software.www.ichemlabs.com
Voila Chemdoodle - $15/month
I've even bought a 1 month contract & a friend plugged it into a simple site on his local computer.
I don't know how much BL takes per month but I PRESUME $15/month is possible.
Yes, it's going to take someone who is an expert on building sites but from what I know, structures can be stored as SMILES strings & then displayed as images with their appropriate IUPAC name below it.
I should add that ACD/Chemsketch offer a free version so that every member can draw & manipulate chemical structures. The only thing I really miss is that it does not carry out the calculations to produce the minimum energy state in 3D. As an example, Fentanyl & BDPC do not look THAT similar in 2D but if one constructs a Dreiding Model (there goes 2-3 hours of your time) and they overlay PERFECTLY. The reason BDPC is more potent than fentanyl is because it's more rigid and it's LogP is higher.
I would be fascinated to know if the addition of beta (S) hydroxy moiety would similarly increase the potency of BDPC (or even better, MDBC whose advantages I have explained elsewhere).
Actually, I don't have any documentry evidence concerning the potency of beta hydroxy fentanyl. I know it's commonly responsible for fatal ODs in Russia (in particular) but the only report I have is from a conversation with RoboJunkie (remember him?. For those who don't, he was a close friend of Superjunkie who, as a subgraduate was making fentanyl for their own use. The usually made plain fentanyl but made 1 sample of beta hydroxy fentanyl which he reported to be about x8 more potent. Well, they got busted. Superjunky (the chemist) got 18 years and last I heard he was STILL in withdrawal after 18 months. Robojunkie was just a cheerleader/fienffriend and the police did not charge him. However, even with his family having the resources to get him the best medical treatment available, it sounds like his CNS has been permanently altered and he;s still rattling. I mean, he's getting a LOT of opioids but none of them help...
I suggest that the phenethyl group binds to an extra site and only drugs that bind with that site will be of any use. I do appreciate that it's merely an anecdote, it does make me extra cautious concerning the fentanyl/4-Phenylphenampromide/Phenoperidine/PEPAP/Anileridine and similar.... the opioids that bind to the '5th site'.Could we PLEASE add a rule - if you pose a scaffold, you have to provide reference to how you would MAKE that scaffold.
Just try finding a benzene with a -Cl next to a -Br next to an -OCH3,
THAT is where 99% of the effort lies - finding efficient routes. I don't mind if you ask a price from a Chinese company & list that, after all, it's a source.U-47700 was popular because it can be made in 1 simple step from commercially available compounds. MXE succeeded because it was made in exactly the same way as K BUT was not controlled in China (i.e. production lines already set up) and Fentanyl can be made in 3 steps from commercially available chemicals AND it's x80M (offsetting costs).
But (R) 7-Me aET (30mg) was better than MDMA but cost x8 as much to make as 6APB so guess what? It never took off.
As a rule - 2 complex steps or 4 simple steps BUT everyone wants a simple, cheap 1 step route and even then it might be dismissed by idiots who bought 500L of piperidine so diphenidine & methoxyphenidine sold, isopjenidine (like MXE) did not. The chemists downright lied in spite of my RT 1 step route with methanol as solvent (it doesn't get much cheaper!_.I'm asking for some help. I had a paper called something like '3D QSAR of mu kappa & delta opioids'. It used CoMFA to show the 3D relationship of key moieties and had a training-set for each type of opiate ligand. 20 of each if memory serves.
It WAS on the Eunoia disc but my HD died and I lost it.
I have searched extensively but not only is it without a doubt the best paper on learning CoMFA & training-sets, but it had a couple of totally novel ligands. I mean ones that do not show up on any searches but had a very high affinity. The order of training-set was from high to low affinity and one of these had the second or third highest.
I've found 1 Janssen paper from the 1960s that mentions related compounds BUT related compounds were neuroleptics so it covers a huge number of compounds and it's not very clear on the examples with opioid activity.
The REALLY odd thing is that it has a piperidine ring but instead of a 2 or 3 carbon chain linking it to a second aromatic, it has just 1 carbon BUT also a -CH3 side-chain which is apparently a requirement....
I've spent weeks looking and so far, nada. If anyone has the Eunoia Disc, it should be easy to find in 5 minutes. I just need the DOI.
Many thanks- Status
- Not open for further replies.