



-
Life Advice & Visual Arts Welcome Guest
Posting Rules Bluelight Rules 🌌 Share Your Dreams! 🌌 📸 15 Years of Photo Contests 📸 -
LAVA Moderator: streaM Freak
You are using an out of date browser. It may not display this or other websites correctly.
You should upgrade or use an alternative browser.
You should upgrade or use an alternative browser.
the market: stocks, bonds, options, whatever
- Thread starter hydroazuanacaine
- Start date




Ibogaine, LSD and Psilocybin: Trump’s New Order a Medical ‘Turning Point’
Military veterans may eventually see newer forms of mental health relief by way of treatments being greenlighted by the president himself.
 www.military.com

ions
Bluelighter
Let's hope.
Here's to healing.
Here's to healing.

Electrum1
Bluelighter
- Joined
- Nov 22, 2021
- Messages
- 34,639
You gotta buy into trials that could be the next thing in areas that have a large TAM. Fat related stuff, diabetes, etc. Herpes, Hep, inflammations. Sure if you hit an oncology trial then you make a bunch, but cancer drug trials are super risky to invest in. You can invest in the hardware like diagnostic equipment but that's not really biotech imo
You can invest in the hardware like diagnostic equipment but that's not really biotech imo
that's XLV, pretty good defensive option. it gets inflows a lot when tech has pullbacks

I didn't know about all that so it's good to hear your guys perspective.
I'm mostly thinking what specific tech think is not yet mainstream but soon (year or two or three) may be - I won't change my mind. And throwing 50 bucks on them (specific ones). Not really monitoring them until they multiply. And yes, most will not.
Did the same thing with aerospace / defence last winter/spring. Some did like 5x, but I think regenerative med and electromagnetic + portable image scanning will do more than 5x, but it probably will take a lot longer. Because, like you mentioned there are stages and trials.
Last edited:
ChatGPT told me that it is possible for the market to continue growing exponentially if the growth and spending keep moving in that direction.
So it could be possible with for example AI, to just make many sectors more efficient and available for people to use.
Make me look stupid and debate that: Go.
So it could be possible with for example AI, to just make many sectors more efficient and available for people to use.
Make me look stupid and debate that: Go.
ions
Bluelighter
the problem with this so called growth (cancer is a growth) and spending is that the purchasing power of the dollar is much lower than before 1913 (advent of the Fed).
Saw a report that Trump wants his face on a 250 dollar bill. Which is only worth 7 dollars and change dating back before the Federal Reserve existed.
Saw a report that Trump wants his face on a 250 dollar bill. Which is only worth 7 dollars and change dating back before the Federal Reserve existed.
ions
Bluelighter
It's not that things are gaining value. It's that the dollar is losing value.
In biblical times you could buy roughly 400 loaves of bread with an ounce of gold. and that generally still holds true.
In biblical times you could buy roughly 400 loaves of bread with an ounce of gold. and that generally still holds true.
yeah, returns in S&P 500 now are driven largely by expansion of M2. Every time they dump more money into the economy, stock market goes up, but purchasing power is eroded.
that is why it's worth being a degenerate gambler and trying to grab some of the growing pie, because so much of it is being pumped into the stock market. buy the winners when they're on a slight discount and try to secure gains periodically so you don't end up a bagholder.
that is why it's worth being a degenerate gambler and trying to grab some of the growing pie, because so much of it is being pumped into the stock market. buy the winners when they're on a slight discount and try to secure gains periodically so you don't end up a bagholder.
ions
Bluelighter
Something's happening down trend in the markets. Silver below $70/oz. BTC at $60k.
It's the elites get rich quick manipulation. I think it's going to trend significant the other direction after a downspike.
It's the elites get rich quick manipulation. I think it's going to trend significant the other direction after a downspike.
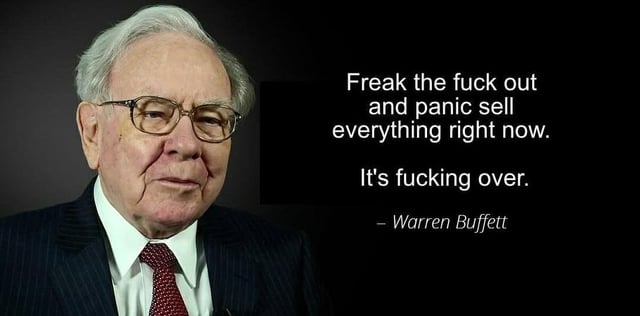
ions
Bluelighter
Please don't.
that's bad advice.
HODL.
that's bad advice.
HODL.
i'm praying for another week of correction, i cashed out some tech equity just in time but need the funds to hit my broker so i can go long on all the things
the bulk of the negative gamma on SPX is at $7300 so we may have already reached the bottom
the bulk of the negative gamma on SPX is at $7300 so we may have already reached the bottom

My liquid assets are split between Canadian bills, global bonds, and prediction markets right now. I have more confidence in my ability to make money in prediction markets than I do in the equity market at current valuations. It's kind of like junk bonds but with a better rate of interest.

Electrum1
Bluelighter
- Joined
- Nov 22, 2021
- Messages
- 34,639
Bitcoin at the 200W moving average 
 www.coinglass.com
Bitcoin 200-Week Moving Average Heatmap (200WMA) | CoinGlass
The CoinGlass Bitcoin 200-Week Moving Average Heatmap (200WMA) visually illustrates Bitcoin’s price performance relative to its 200-week moving average. Using color gradients to show deviations from the long-term mean, red tones indicate overvaluation while green tones highlight undervalued...
www.coinglass.com