

Jabberwocky
Frumious Bandersnatch
Any gamblers here?
1). What is a Stock?
A stock (also known as "shares" or "equity) is a type of security that signifies proportionate ownership in the issuing corporation. This entitles the stockholder to that proportion of the corporation's assets and earnings.
Stocks are bought and sold predominantly on stock exchanges, though there can be private sales as well, and are the foundation of nearly every portfolio. These transactions have to conform to government regulations which are meant to protect investors from fraudulent practices. Historically, they have outperformed most other investments over the long run. These investments can be purchased from most online stock brokers.
2). Types of investment vehicles
Stock: A piece of ownership of a corporation. Owners of stock (called stockholders) are entitled to the company’s profits in the form of dividends, as well as voting rights for company management.
Options: A type of derivative that gives a buyer the choice to buy/sell a position by a certain date. The seller of the option gets a premium and keeps his/her position if the option expires worthless.
Futures: A type of derivative that fixes a set price for a buyer and a seller at a future date.
Bonds: A type of fixed-income investment which is debt for the issuer and an asset for the buyer. Payments (called coupons) are paid in regular intervals, and the principals is repaid when the bond reaches maturity.
ETF: Acronym for exchange-traded fund. Usually a group of assets, but sells very similarly to a single stock.
Forex: Short for foreign exchange. Trading currencies. Usually highly leveraged and risky.
3). Know the metrics
There are dozens of metrics you can use to evaluate a stock, but the following are some of the best for locating undervalued stocks:
4). Know technical Analysis
This is a way to guesstimate trends by looking at the actual stock chart.
Support/Resistance
By visually marking the charts, users can see certain price levels that tend to prevent prices from falling any further before rising back up again. These are known as price support levels. Users will also spot price levels that continue to provide a ceiling, that eventually causing prices to fall back down again after testing. These are known as price resistance levels.

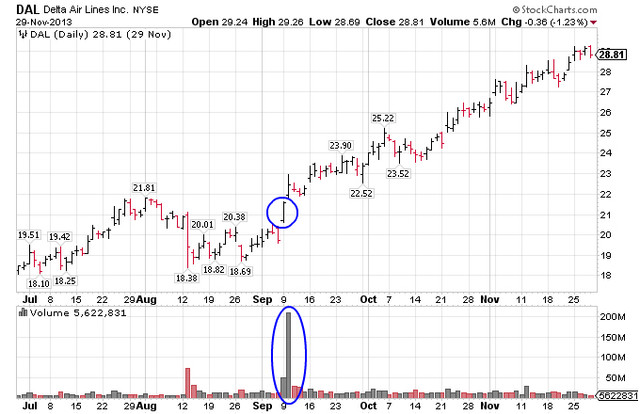
Stock Volume
Volume measures the total number of shares traded for a specified period of time. It is used as a measure of interest that can manifest into significant price action. High volume indicates significant trading activity that triggers a breakout or a breakdown accompanied by a sustaining trend in prices. Breakouts result in higher trending prices and breakdowns result in lower trending prices. When volume is light, stocks tend to chop around in a range known as consolidation.
Trends
Trends indicate the current direction of share prices. When stock prices continue to rise higher, it is considered to be in an uptrend and vice versa for a downtrend. Uptrends indicate increasing demand for shares, as buyers are willing to pay higher prices as supply diminishes. Downtrends represent an oversupply of shares with waning buying interest resulting in falling prices. By connecting the various high and low points on a chart, you can manually generate trendlines that pinpoint support/resistance and direction of stock prices. When compared to historical templates of similar trendlines, you may be able to forecast the future direction, turning/inflection points and targets.
5). Compare to the industry
Knowing ratios and technical analysis is one thing, but comparing a stock relative to their industry is a must.
6). Industry News
Pretty self explanitory. Look for news on the stocks you're interested in to see if they have any hints on whether or not the stock is under or over valued.
Ratios - www.macrotends.net (my favorite)
Tech. analysis - https://stockcharts.com/school/doku.php?id=chart_school:overview:technical_analysis
Industry comparison - https://www.zacks.com/stock/research//industry-comparison
News - https://seekingalpha.com/market-news/all
-----------------------------------------------------------------------------------------------------------
The more people invested in your stocks, the more money you are likely to make.
That said, who are YOU investing in??
-----------------------------------------------------------------------------------------------------------
Bluelight doesn't like advertising or self-promotion, but I'm using Robbinhood.com as my preferred platform for trading because they don't take commission on trades. In other words, buying and selling is FREE! This is a very uncommon phenomenon. They also allow you to trade on margin (borrowing money from them) and also allow up to$1,000 in INSTANT deposits (you can trade immediately, as opposed to waiting for the transaction to be completed by your bank). If anyone is interested, PM me and I can share a referral to help us both get free stock.
Anyone else using other trading sites? if so, what do you like or dislike about it?
1). What is a Stock?
A stock (also known as "shares" or "equity) is a type of security that signifies proportionate ownership in the issuing corporation. This entitles the stockholder to that proportion of the corporation's assets and earnings.
Stocks are bought and sold predominantly on stock exchanges, though there can be private sales as well, and are the foundation of nearly every portfolio. These transactions have to conform to government regulations which are meant to protect investors from fraudulent practices. Historically, they have outperformed most other investments over the long run. These investments can be purchased from most online stock brokers.
2). Types of investment vehicles
Stock: A piece of ownership of a corporation. Owners of stock (called stockholders) are entitled to the company’s profits in the form of dividends, as well as voting rights for company management.
Options: A type of derivative that gives a buyer the choice to buy/sell a position by a certain date. The seller of the option gets a premium and keeps his/her position if the option expires worthless.
Futures: A type of derivative that fixes a set price for a buyer and a seller at a future date.
Bonds: A type of fixed-income investment which is debt for the issuer and an asset for the buyer. Payments (called coupons) are paid in regular intervals, and the principals is repaid when the bond reaches maturity.
ETF: Acronym for exchange-traded fund. Usually a group of assets, but sells very similarly to a single stock.
Forex: Short for foreign exchange. Trading currencies. Usually highly leveraged and risky.
3). Know the metrics
There are dozens of metrics you can use to evaluate a stock, but the following are some of the best for locating undervalued stocks:
- EBITDA: Any investment banker knows what EBITDA is - Earnings Before Interest, Tax, Depreciation and Amortization. This is how a company is valued all together, and the lower the margin, the better.
- Price-to-earnings (P/E) ratio: By dividing a stock's current share price by its annual earnings, you can calculate this metric, which is useful for comparing companies in the same business. A lower P/E means a stock is "cheaper," but this is just one variable to consider. The current average market P/E ratio is roughly 20 to 25 times earnings.
- Price-to-book (P/B) ratio: Calculated by dividing a stock's price by its equity per share. A book value of less than one implies that the stock is trading for less than the value of a business's assets. Value investors use P/B multiples to find stocks with a margin of safety. Traditionally, a ratio under 1 is considered good.
- Price-to-earnings to growth (PEG): Found by dividing a stock's P/E ratio by its projected earnings growth rate over a certain time period -- typically the next five years. This can be effective for assessing the valuation of a company with a seemingly high P/E, but whose earnings are growing rapidly. PEG ratios higher than 1 are generally considered unfavorable, suggesting a stock is overvalued.
- Return on equity (ROE): A company's annualized net income as a percentage of shareholders' equity. This is a measure of how efficiently a company is using invested capital to generate profits. ROEs of 15-20% are generally considered good.
- Debt-to-equity ratio: As the name implies, this is calculated by dividing a company's total debt by its shareholders' equity. A good debt to equity ratio is around 1 to 1.5. However, the ideal debt to equity ratio will vary depending on the industry because some industries use more debt financing than others.
- Current ratio: A liquidity metric calculated by dividing a company's current assets by its current liabilities. This tells investors how easily a company can pay its short-term obligations. Acceptable current ratios vary from industry to industry and are generally between 1.5% and 3% for healthy businesses.
4). Know technical Analysis
This is a way to guesstimate trends by looking at the actual stock chart.
Support/Resistance
By visually marking the charts, users can see certain price levels that tend to prevent prices from falling any further before rising back up again. These are known as price support levels. Users will also spot price levels that continue to provide a ceiling, that eventually causing prices to fall back down again after testing. These are known as price resistance levels.
Stock Volume
Volume measures the total number of shares traded for a specified period of time. It is used as a measure of interest that can manifest into significant price action. High volume indicates significant trading activity that triggers a breakout or a breakdown accompanied by a sustaining trend in prices. Breakouts result in higher trending prices and breakdowns result in lower trending prices. When volume is light, stocks tend to chop around in a range known as consolidation.
Trends
Trends indicate the current direction of share prices. When stock prices continue to rise higher, it is considered to be in an uptrend and vice versa for a downtrend. Uptrends indicate increasing demand for shares, as buyers are willing to pay higher prices as supply diminishes. Downtrends represent an oversupply of shares with waning buying interest resulting in falling prices. By connecting the various high and low points on a chart, you can manually generate trendlines that pinpoint support/resistance and direction of stock prices. When compared to historical templates of similar trendlines, you may be able to forecast the future direction, turning/inflection points and targets.
5). Compare to the industry
Knowing ratios and technical analysis is one thing, but comparing a stock relative to their industry is a must.
6). Industry News
Pretty self explanitory. Look for news on the stocks you're interested in to see if they have any hints on whether or not the stock is under or over valued.
Ratios - www.macrotends.net (my favorite)
Tech. analysis - https://stockcharts.com/school/doku.php?id=chart_school:overview:technical_analysis
Industry comparison - https://www.zacks.com/stock/research//industry-comparison
News - https://seekingalpha.com/market-news/all
-----------------------------------------------------------------------------------------------------------
The more people invested in your stocks, the more money you are likely to make.
That said, who are YOU investing in??
-----------------------------------------------------------------------------------------------------------
Bluelight doesn't like advertising or self-promotion, but I'm using Robbinhood.com as my preferred platform for trading because they don't take commission on trades. In other words, buying and selling is FREE! This is a very uncommon phenomenon. They also allow you to trade on margin (borrowing money from them) and also allow up to$1,000 in INSTANT deposits (you can trade immediately, as opposed to waiting for the transaction to be completed by your bank). If anyone is interested, PM me and I can share a referral to help us both get free stock.
Anyone else using other trading sites? if so, what do you like or dislike about it?
Last edited by a moderator:


") Never heard of robinhood. Ive been personally using the "Think or Swim" platform from TD Ameritrade which is pretty good. Ive heard good things about ninjatrader, but never really looked into it though. Ill have to check robbinhood out as well. I literally have no idea what the commission is on the "Think or Swim" platform (for futures). Probably something I should look into LOL. But you cant be free!!! (with robbinhood)
Never heard of robinhood. Ive been personally using the "Think or Swim" platform from TD Ameritrade which is pretty good. Ive heard good things about ninjatrader, but never really looked into it though. Ill have to check robbinhood out as well. I literally have no idea what the commission is on the "Think or Swim" platform (for futures). Probably something I should look into LOL. But you cant be free!!! (with robbinhood)